Examples
These examples show how price changes impact the depiction of profit, revenue, and unit volume in the Price Analyzer graphs.
All three curves in the graphs must be considered together. In the following example, a 20% price increase will drive a + 40% increase in profit (red curve), no change in revenue (green curve), and a -20% decrease in unit volume (blue curve) for the selected product (all values are approximations).
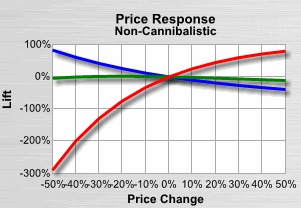
In this example, the Price Response - Non-Cannibalistic graph was used to view the effects of a base price change on the selected product and other products in the category before adjusting the Base Price Lift Segmentation chart.