Adding processes to flowcharts
You can add a process to a flowchart by dragging a process box from the palette to the workspace.
The procedure that follows explains how to drag processes into a flowchart. Other methods of adding processes are to copy an existing process (right-click, copy, then paste), or paste a template from the template library. Templates contain one or more configured processes and connections. For more information, read about using templates.
Follow these steps to add processes to a flowchart.
1.
Select
Campaign
>
Campaigns
.
2.
Use one of the following methods to open a flowchart:
Click the name of a campaign, then click a flowchart tab, then click the
Edit
icon
in the toolbar.
Use the
Edit a tab
icon
next to a campaign name to open a flowchart in that campaign.
The flowchart window opens and the palette appears at the left of the workspace.
3.
Drag a process box from the palette to the flowchart. You can drop the process box into the workspace as soon as the box turns green and displays a plus sign.
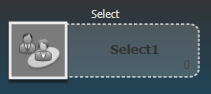
Newly added process boxes are transparent until they are configured.
Typically, the next step is to configure the process, by double-clicking it in the workspace to open the configuration dialog.
To see a list of available actions, you can right-click a process box in the workspace.
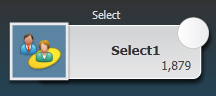
Configured process boxes have a solid background and border. The round status icon is blank to indicate that the process has not yet run.
4.
Click the
Save and Continue
icon
frequently to save your changes.
As you develop the flowchart, place each subsequent box in a logical position, such as left to right or top to bottom, and connect the boxes to indicate the flow of data. Some processes must be connected before they are configured because they require input from the source process.
For example, configure a Select process to select households in a specific earning bracket, then connect it to an Audience or Merge process. Finally, you test run the process or branch.
See the other available topics for information about configuring, connecting, and running processes.
Copyright IBM Corporation 2015. All Rights Reserved.