Example: process connections
The way processes are connected in a flowchart determines the flow of data.
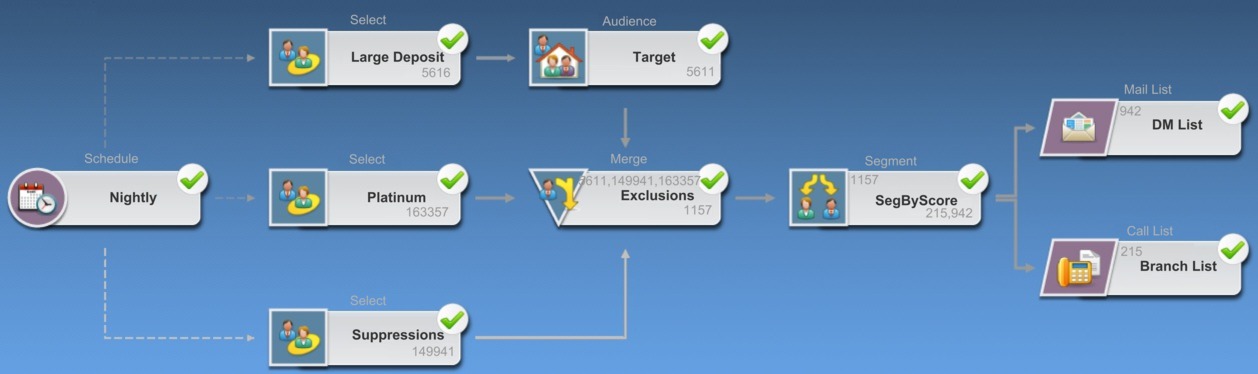
Flowchart scheduled to run every night
The following flowchart starts with a Schedule process that is configured to run automatically every night. The dotted lines from the Schedule process to the three Select processes indicate a temporal dependency. The Select processes will not run until the Schedule process finishes running. However, no data is passed from the Schedule process to the Select processes. The solid lines between the other processes show the flow of data. For example, the merged selections flow from the Merge process (labeled "Exclusions") into a Segment process ("SegByScore"). The segmented selections then flow into Mail List and Call List processes, so the offers can be delivered by different channels.
Appearance of connection lines
When a destination process receives data from a source process, the connection is shown as a solid line.
When a destination process depends on a source process but does not receive data from it, the connection is shown as a dotted line. A dotted line indicates that the destination process cannot run successfully until the source process completes. In this way, you can identify processes that are time-dependent on each other.
Connection lines can be angled (slanted) or straight (right angles only). The lines in the previous example are straight.
To change line appearance, right-click in the flowchart workspace, choose
View
, and check or uncheck
Angled Connections
.
Copyright IBM Corporation 2015. All Rights Reserved.