Cell Waterfall report example
This example shows how you can use a Cell Waterfall report to identify processes that affect output volume. The report provides details about the output by percentage and quantity.
This example analyzes the output from a Select process named "Gold" in a Multi-Channel Retention campaign flowchart.
Cell Waterfall report example
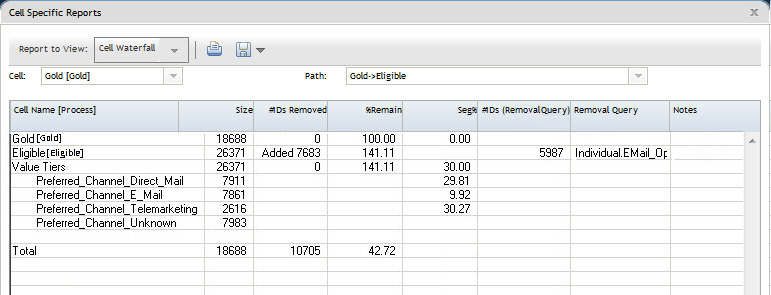
The Cell Waterfall report for this flowchart is shown in the following figure. The Gold cell is selected in the Cell list at the top of the report. Therefore, the report analyzes the output from the "Gold" Select process. The Path list is not relevant in this example because the Gold cell has only one path in this flowchart (from Gold to Eligible). If the Gold process box provided output to other processes in the flowchart, you could use the Path list to look at other sequences.Screen capture of a Cell Waterfall report
Each cell is identified by its Output Cell Name, plus a [Process Name] shown in square brackets. These names were assigned on the General tab of the process configuration dialog.
This example report shows the following progression:
1.
2.
3.
4.
5.
The Total row shows how many IDs the Gold process originally selected. This row also shows the number and percentage of Gold IDs that remain.