Example of a campaign that uses SPSS® Model and SPSS® Score processes
Marketers at ABC Bank want to promote savings accounts to customers by providing special high-interest rates. They ran a marketing campaign that targeted 1000 customers. The results of the campaign were poor as few customers accepted the offer. Now, the marketers want to target an additional 1000 customers. To get better results from the campaign, they want to analyze the responses from the previous campaign to find customers who have a higher probability of accepting the offer.
Run a marketing campaign to promote a new savings account
The campaign designer can create this campaign by completing the following steps:
1.
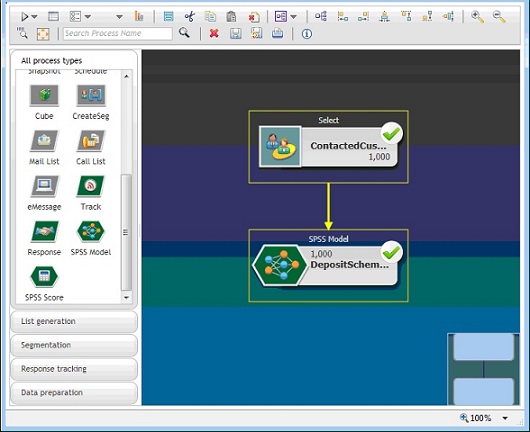
In IBM® Campaign, open a flowchart in Edit mode to create a model that analyzes data from previous responses.
2.
3.
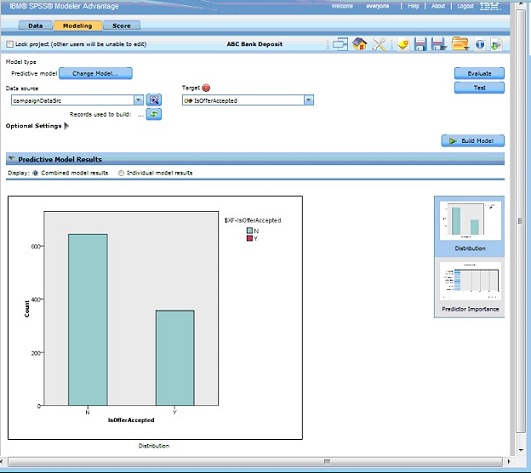
Drag an SPSS Model process box to the flowchart workspace. Configure it to use account type, account balance, average yearly account balance, last transaction amount, and salary to create the model.
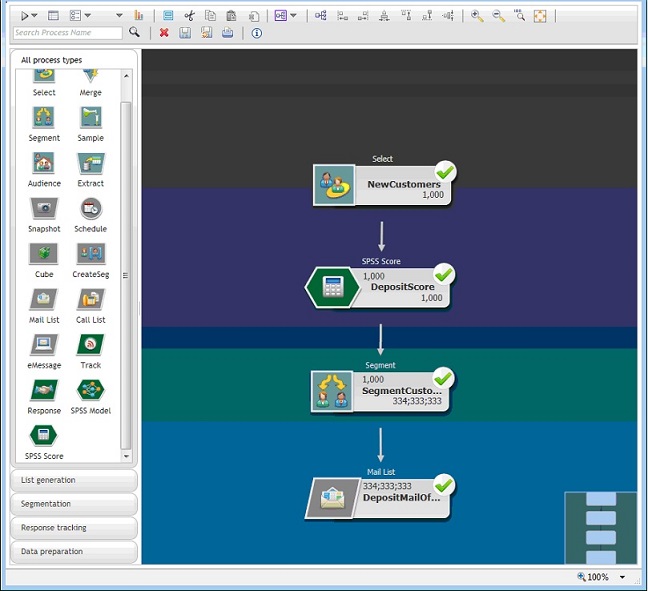
The following example shows the modeling flowchart details.
The flowchart contains a Select process box, which contains data on 1000 contacted customers, connected to an SPSS Model process box.
4.
The predictive model is created by IBM® SPSS® Modeler Advantage Marketing Edition and is based on the data that is provided by IBM® Campaign. This model helps the marketer to predict the behavior of other customers.
The following example shows the created model in IBM® SPSS® Modeler Advantage Marketing Edition.
The SPSS Modeler Advantage screen displays the Modeling Tab.
When the Model is ready in IBM® SPSS® Modeler Advantage Marketing Edition, it can be used for predicting the behavior of customers. ABC Bank has a list of 1000 customers that comprise the potential target audience for the new campaign.
5.
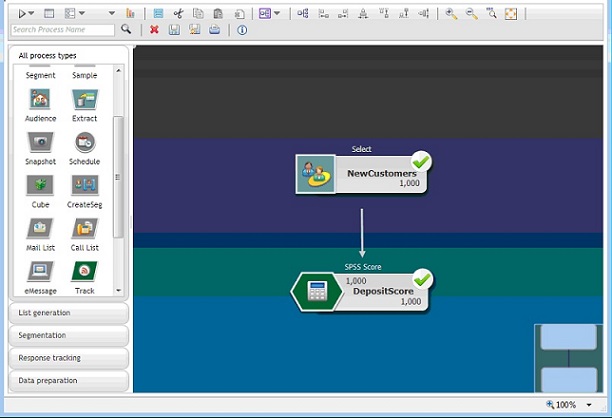
In IBM® Campaign, open a flowchart in Edit mode in which the customer data is sent to IBM® SPSS® Modeler Advantage Marketing Edition for scoring based on the previously created model. Configure the SPSS Score process box to select the newly created model for scoring.
The following example shows the scoring flowchart details.
The flowchart contains a Select process box, which contains data on 1000 new customers, connected to an SPSS Score process box.
In the following example, the IBM® SPSS® Modeler Advantage Marketing Edition Score tab shows the output field and data source details.
The SPSS Modeler Advantage screen displays the Scoring Tab.
6.
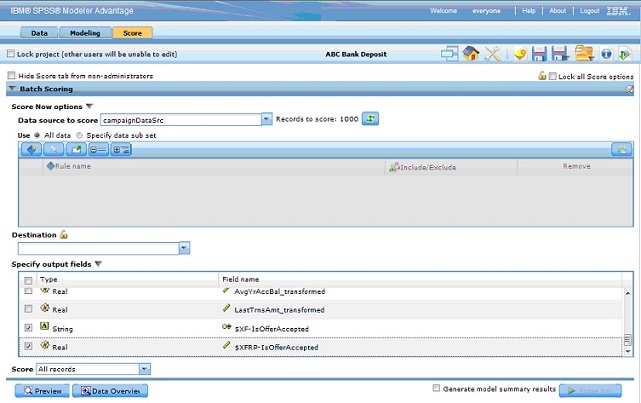
Score the data in IBM® SPSS® Modeler Advantage Marketing Edition, and the scoring results are provided to IBM® Campaign.
7.
In the IBM® Campaign flowchart, use marketing logic to optimize the list based on the score that is received for each customer.
The marketing offer will be assigned and delivered to the targeted list of customers using various channels.
The flowchart contains a Select process box, which contains data on 1000 new customers, connected to an SPSS Score process box. The SPSS Score process box is connected to a Segment process box, which is connected to a Mail List process box.