|
|
If mean and std are constants, these values are used to specify the Gaussian for all values in data.
|
|
|
|
|
If mean and std are column ranges (both must be the same number of columns as data), each cell in data uses its individual pair of corresponding cells in mean and std.
|
|
|
In the last case above, when mean and std are column ranges, the length of each column determines how many rows will be present in the corresponding output column. If a column of mean or std is a single cell, that value will be used for all row values of data. If mean or std contain multiple rows, the corresponding rows are calculated. Rows of data for which there are no corresponding values in mean and std are not computed.
|
|
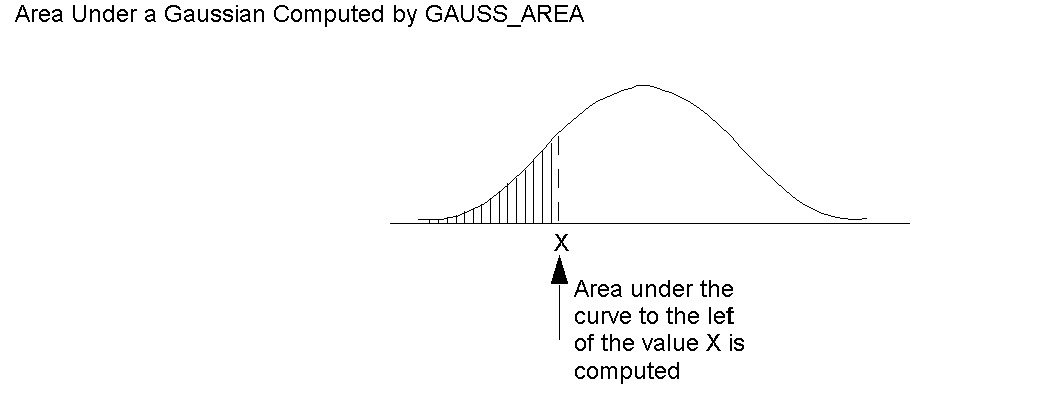
TEMP = GAUSS_AREA(0) or TEMP = GAUSS_AREA(0, 0, 1)
|
|
Creates a new column named TEMP, where each value is the area under the Gaussian of the corresponding row of column V1, using a zero-mean, unit-variant Gaussian.
|
|
Creates three new columns named TEMP, VX, and VY. The values in the TEMP column are the areas under the Gaussians of column V1, the values of the VX column are the areas under the Gaussians of column V2, and the values of the VY column are the areas under the Gaussians of column V3. The Gaussian is zero-mean and unit-variant.
|
|
Creates three new columns named TEMP, VX, and VY. The values in the TEMP column are the areas under the Gaussians of rows 1-50 column V1, the values of the VX column are the areas under the Gaussians of rows 1-50 column V2, and the values of the rows of the VY column are the areas under the Gaussians of column V3. The Gaussian is zero-mean and unit-variant.
|
|
Creates a new column named TEMP, where each value is the area under the Gaussian of the corresponding row of column V1. The Gaussian has a mean of 0 and a standard deviation of 3.5.
|
|
Creates a new column named TEMP, where each value is the area under the Gaussian of column V1, using the corresponding row value of column V2 as the mean and the corresponding row value of column V3 as the standard deviation.
|
|
Creates two new columns named TEMP and VX. The column TEMP contains the areas under the Gaussians of the values in V1 using the corresponding rows of column V3 as the mean and the corresponding rows of column V5 as the standard deviation. The column VX contains the areas under the Gaussians of the values in V2 using the corresponding rows of column V4 as the mean and the corresponding rows of column V6 as the standard deviation.
|
|
Copyright IBM Corporation 2015. All Rights Reserved.
|