Cell Waterfall report
The Cell Waterfall report shows the falloff of audience members as cells are input and output through the various processes in a flowchart. This report identifies processes which have reduced output volume and the details of the reduction by percentage and quantity. Use Cell Waterfall reports to refine target counts by viewing the falloff incurred by each successive criteria.
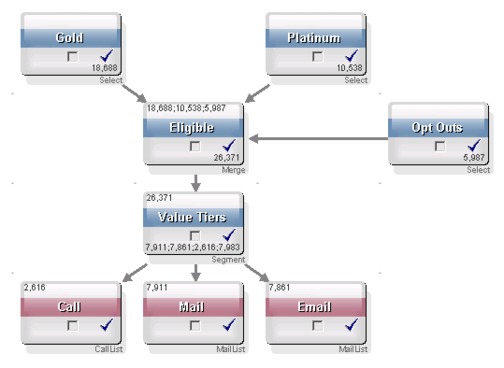
In the following example, the report profiles the Gold.out cell from the Gold process in the Multi-Channel Retention Campaign flowchart.
The IDs in the Gold.out cell are passed to the Merge process named Eligible. The output cell of the Merge process, Eligible.out, adds 7683 IDs to Gold.out, which then is merged with the Planinum.out cell, resulting in an increase rather than a decrease in the number of IDs. Because of the Opt Outs process, some IDs are extracted from the merged result of Gold.out and Platinum.out, resulting in a number less than the sums of the two cells. Next, the Eligible.out cell is passed to a Segment process called Value Tiers, where Eligible.out is parsed into several different contact channels.
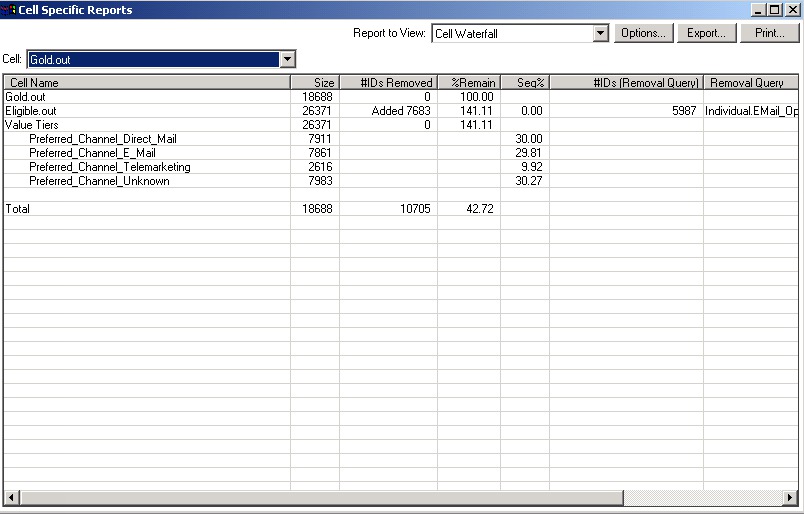
The Cell Waterfall report based on this flowchart is shown in the following figure.
The Totals row in the Cell Waterfall report shows that 10,705 IDs were removed from the Gold.out cell. The report also displays the number IDs remaining, as well as the percentage of original Gold.out IDs remaining.
Cell Waterfall report for Multi-Channel Retention Campaign flowchart
Copyright IBM Corporation 2013. All Rights Reserved.